Analysis

Dataset by DataSD

Hate Crimes in San Diego (2016-2020)

The largest heat spots indicate that up to six Hate Crimes occurred in that area. These clusters tended to appear in the central and southern coastal areas of San Diego, with a greater instances of Hate Crimes in the Normal Heights neighborhood and south of the Little Italy neighborhood. There are also notable areas of four Hate Crime incidents near the North Island Naval Air Station on the Coronado Peninsula, and four Hate Crime incidents on the east side of San Diego by El Cajon.

Dataset by DataSD

Hate Crimes by Motivation in San Diego (2016-2020)

While there are 9 possible motivations, the majority of the points represent Hate Crimes that are motivated by race (87 incidents), sexual orientation (53 incidents), or religion (38 incidents). The remaining motivators accounted for 1-3 incidents each.

Dataset by DataSD

Hate Crimes based on Type of Crime in San Diego (2016-2020)

We can see that vandalism is the most common type of Hate Crime in San Diego, followed by threat and assault with no weapon. The category “Other” includes a total of four Hate Crime incidents: burglary (two incidents), arson (one incident), and simple assault (one incident).

Dataset by DataSD

Hate Crimes based on Weapon used in San Diego (2016-2020)

The category “Other” actually accounted for the largest number of Hate Crimes, totaling 52 incidents. This category included a range of weapons ranging from “Sharp Object” (three incidents), to “BB Gun” (one incident). However, the top single category of weapon was “Hands, Fist Feet”, totaling 42 Hate Crimes. This is followed by “Spray Paint” with 25 incidents and “Phone” with 17.

Dataset by DataSD

Hate Crimes based on Suspect Race in San Diego (2016-2020)

95 of the reported Hate Crime incidents noted the perpetrator as race “Unknown”. The next largest suspect race category was “White” (47 incidents), followed by “Hispanic” (22 incidents) and “Black” (21 incidents). There were two incidents total involving suspects of “Asian” or “Asian Pacific American” race.

Dataset by DataSD

Hate Crimes based on Suspect Sex in San Diego (2016-2020)

There were 92 Hate Crime incidents involving male suspects, and 8 involving female suspects. 85 Hate Crime incidents reported suspects of unknown sex and 2 were reported as “Other”.

Dataset by DataSD

Hate Crimes based on Victim Race in San Diego (2016-2020)

55 reported incidents involved “White” victims, 44 involved “Black” victims, 37 involved “Hispanic” and 10 reported victims as “Other”. 8 incidents involved “Asian” victims. There was one victim each for “Asian Pacific American” or “American Indian or Alaskan Native”. 1 Hate Crime involved a victim of an unknown race.

Dataset by DataSD

Hate Crimes based on Victim Sex in San Diego (2016-2020)

Nearly twice as many Hate Crime incidents were reported with male victims (102 incidents) than with female victims (55 incidents).

Dataset by FBI CDE

Reported Cases per Year splited into Offender Race

From 1994 to 2020, White is the most common offender race (except for the years 1999, 2008, 2016, 2017, 2019 where there are more Unknown cases than cases where the offender is White).

Additionally, the years leading up to 2001 show a general increase with 2001 being the highest peak. This makes sense as this is when the tragedy 9/11 took place which resulted in an increase of Hate Crime across America. However, it appears to be a general decrease after 2001 indicating that Hate Crime has decreased over time.

Dataset by FBI CDE

Hate Crime Biases

The pie chart highlights the Biases for which Hate Crimes have been committed. In other words, it is the biases the offender has as their motivation behind the Hate Crimes which are Gender, Disability, Sexual Orientation, Religion, and Race. Race is the most popular motivation as more than half of the cases are for this reason at 61.89%, followed by Sexual Orientation at 22.90%, Religion at 14.51%, Gender at 0.39%, and Disability at 0.31%. Hovering over each piece of the pie shows a more in depth look at the particular Bias.

In the details for the Race portion we see that the most targeted race is African Americans with the highest bias as Anti-Black or African American followed by Anti-Hispanic or Latino. The trend over time peaked in 2001, however shows a decrease in the number of cases

For Sexual Orientation highlights that the majority of Hate Crimes based on Sexual Orientation are Anti-Gay (Male) as it is 60% of the cases in the category. There is also a general decrease over time with peaks around 1995 and 2001.

The bias against Religion, shown in Figure 5 below, shows that over 60% of the cases are Anti-Jewish. It is an overwhelmingly large percentage that are against Jewish people, with Anti-Islamic next but only at around 12%. The peak of Hate Crime against religions in the year 1999 which is when the Los Angeles Jewish Community Center Shooting occurred which likely caused a domino effect in San Diego, but over time we see there is a decrease in Hate Crimes against religion.

Bias against Gender though only consists of 14 cases from this dataset, shows us that majority of Hate Crimes in this category are Anti-Transgender at close to 80%. The trend over time has peaked more recently in 2019 which was noted by the Human Rights Campaign.

The last category of bias against Disability has only 11 cases from the dataset. Over 60% of the cases were Anti-Mental disability while the remaining percentage were Anti-Physical Disability. There appears to be a peak around the year 2002, which is when the Supreme Court ruled that executing people with mental disabilities violates the 8th amendment in the Atkins vs Virginia case.

Dataset by FBI CDE

Hate Crime Type of Offenses

The next pie chart describes the offenses, shown in Figure 8 below, which shows each type of offense by hovering over the pieces. The highest percentage is light orange at 27.16% which is Destruction/Damage/Vandalism of Property. Following this in green is Intimidation at 25.34%, then in red is Simple Assault at 24.73%, in dark blue is Aggravated Assault at 17.02%. The last few offenses are small in comparison which are Robbery, Burglary/Breaking and Entering, Arson, Murder and Nonnegligent Manslaughter, and Unknown cases as well.

Dataset by FBI CDE

Areas of Hate Crime

This visualization is a map of San Diego County that indicates the number of cases based on different cities in San Diego. The name of the city and the total reported cases show once it is hovered over. The region with the most cases is San Diego with 2,345 cases, which makes sense as this accounts for Downtown San Diego which is a bigger city compared to other suburban regions. The next highest is in Oceanside with 300 cases.

Dataset by FBI CDE

Percentage per Location

The last visualization for the FBI CDE dataset is a Tree Map that shows Percentage per Location which has the most prominent locations in darker red colors on the left side and the least prominent locations in lighter yellow colors on the right side. By hovering over each square in the chart, we see the percentage and a line chart of the trend over time. The chart highlights that the most popular locations for Hate Crimes to occur are the Highway, Road, Alley, Street, Sidewalk at 28.03%.

If we hover over Highway/Road/Alley/Street/Sidewalk we see that there was a peak before and leading up to 2002, but the following years saw a rapid decline and overall has generally decreased. The next most popular location is Residence/Home at 26.87% and as seen in the Tooltip has a huge peak at 2001, which again makes sense as this is at the time of 9/11, after this however the plot shows there is a general decrease. The next prominent locations include Parking/Drop Lot/Garage at 7.75% and School/College at 6.17%. All other locations including Church/Synagogue/Temple/Mosque, Jail/Prison, and Field/Woods are all less than 5%.

Dataset by U.S. Census Bureau

Comparison of Case-Race-Ratio (2013-2019)

The next dataset we will use to look at for visualizations is from the U.S. Census Bureau in cooperation with the Population Estimates Program.

First we analyzed the share of the different races in the Population in San Diego County over the years 2013 until 2019. In the graph you can see that there were no significant differences in the shares of the races in the population. This allows us to use the mean of the shares of these 5 races within the 7 years as a representative share for the population of San Diego County. These calculated numbers give us the representative shares of the races in the population of San Diego County which you can find also in the graph above.

White is the predominant race of people that live in San Diego. More than 75% of the population belongs to this race. The next biggest race are Asians with a share slightly smaller than 12%. The next two less dominant races are Black or African American and people with multiple races, both of these groups have a share close to 5%. The smallest group in the population are the American Indian and Alaska Natives with a share smaller than 1%.

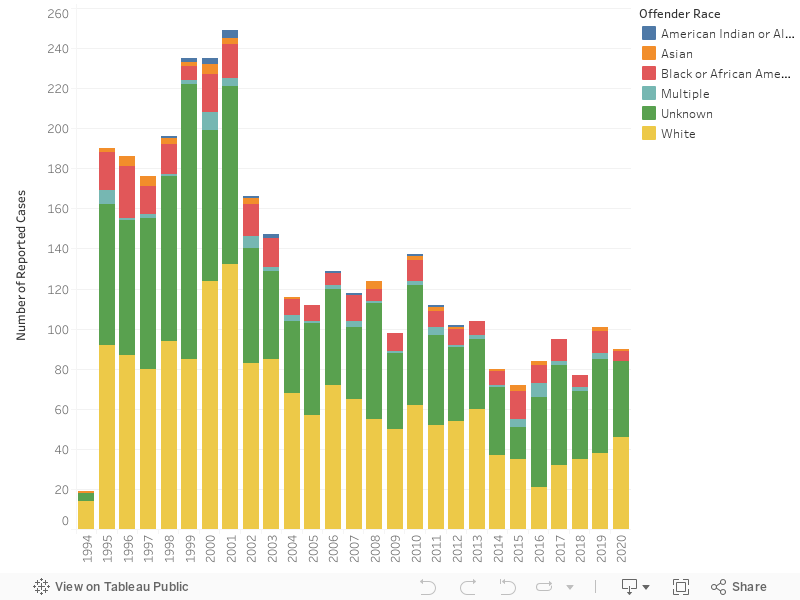
We can now use these shares of races in the population to compare the population with the hate crime numbers.

For the American Indian or Alaska Native race, we found the smallest difference in the share in the population compared to the share in hate crimes. They represent about 0.7% of the population and commit 1% of all hate crimes. The difference is equally small for multiracial people. They make up about 5.5% of the population and commit about 3% of hate crimes.

White race makes up about 76% of the population and commits about 80% of hate crimes. Although they do by far commit the highest percentage of hate crime offenses, putting this number in perspective with the population percentage of White people shows there is technically a small difference given the enormous size of the share in the population.

The biggest difference can be seen in the race of Asians and Black or African Americans. Asians represent about 13% of the population but only commit about 2% of hate crimes, which is a large difference in this analysis.

African Americans make up about 5% of the population but in this dataset committed approximately 14% of Hate Crimes.

However, we cannot make any definite conclusions. There are various societal confounding factors involved in data analysis related to racial groups, and we should not conclude anything about which race is the biggest offender race. For instance, unfortunately there are often racial biases within the police department. This leads to a higher level of scrutiny and unfair treatment of African Americans. Consequently, when dealing with matters about race, one needs to be careful, there are racial biases throughout our whole society, therefore we cannot draw any definitive conclusions.